Structuring your program to consider memory can improve performance. Wesley Maness and Richard Reich demonstrate this with a producer–consumer queue.
In this paper, we explore cache-line friendly data structures, in particular queues built with atomics that will be used in multi-threaded environments. We will illustrate our topic with a real-world use case that is not cache-line aware, measure, incorporate our suggestions, measure again, and finally review our results. Before we get into the nuts and bolts of our data structures, we need to define a few terms followed with some examples. For those readers who are not familiar with the topics of NUMA and CPU cache, we highly recommend reviewing them (at [ Wikipedia-1 ] and [ Wikipedia-2 ]).
Jitter
Jitter can be defined as the variance of time around operations that can arguably have constant time expectations.
A few examples to better illustrate are:
- The wall clock on a system in which each ‘tick’ of the highest-precision unit has some variance. Back in 2012, we measured the wall clock on the best server we had at the time. It was accurate down to 1 microsecond. However, we had jitter of ±1.5 microseconds. Consider that the clock’s accuracy increases over longer time periods, but each tick jittered.
- When we are linearly accessing memory in a system, each access may take a constant time until you hit a page fault. That page fault can introduce delay. In this case, we have a constant time operation that ends up having predictable jitter.
-
Sparsely accessing an array can have many cache misses as well as cache hits. Depending on the location and layout of the memory, what should be constant will be different depending on:
- Is the memory in the same NUMA node? [ Tsang17 ]
- Is the memory located in the cache?
- Which cache is the memory located in? (L3, L2, L1)
- Is the memory in the current cache line?
- Is the memory contended with another CPU socket/core?
Many of the above are just examples which are not investigated in the scope of the paper and many can also be mitigated by using prefetching.
Cache line
The cache line is the smallest unit of RAM the CPU can load to perform operations. On the Intel CPU, this is 64 bytes, or 8 pointers in a 64-bit operating system. If at least one of the cores is writing, then cache coherency causes the cache line to be synchronized between the cores as each write forces a synchronization between the cores. Many cores reading from the same cache line causes no performance issues if there is no writing to that same cache line.
Cache awareness
Cache awareness really comes down to structuring your memory layout (memory model) of your program and its data structures. Careful consideration of what memory goes where can significantly improve the performance of the resulting machine code that must be verified by measuring.
For example, if we look at the Intel core i7 [ Levinthal09 ] we can see its specifications are: L1 is 4 CPU cycles, L2 is 11 CPU cycles and L3 is 30-40 CPU cycles. Main memory can range from 200-350 CPU cycles on a 3GHz system. Crossing NUMA nodes incurs even more penalties. Code that sparsely accesses memory incurring many cache misses can spend 95% of the time doing nothing!
Motivation
In previous sections, we hinted as to why we would want to be cache aware, but here we will explain in a bit more detail, and then consider the benefits of potential future hardware progression and its impact.
From a multi-threading perspective, we need to be sure that data that are independently accessed by different threads are not shared over a cache line. Doing so will cause all reading threads to stall while the dirty cache line is synchronized across all cores. This is compounded if one or more of the threads exists on a different NUMA node.
The most direct benefit of fully independent data between threads not sharing cache lines is linear scalability. Some of the most obvious costs are:
- Increased code complexity due to increased complexity of the memory model.
- If each thread is accessing small amounts of data, some of the space in each cache line may not be utilized.
- Because of the above, we may need more memory to force alignment. If memory is limited, this could require special consideration.
- Perhaps there are multiple copies of the same data in various locations resulting in less efficient usage of memory.
Each socket is being packed with more and more cores, and FPGA integration into Intel CPUs is on the horizon (as this is written) [ Intel ] [ Patrizio17 ]. This will effectively model memory to separate memory access at the cache-line level (to avoid false sharing [ Bolosky93 ]). Furthermore, it will have a greater impact as cores and specialized hardware compete for resources.
Next, we will demonstrate the necessity of cache-line awareness with a modern-day use case that would benefit nicely from such consideration.
Common use case
There exist situations in technology where we find ourselves having to set up and use a shared environment with many agents performing various coordinating tasks. In this use case, we will be given a machine in which we have a single multi-producer multi-consumer queue (MPMC) instance shared amongst a set of producers and consumers. The producers, we can assume, are clients which are running some computations and generating work, or some partial work. Hence each client would be running a different set of computations and each of those publishing their resulting work items to the MPMC for later consumption. Each consumer would be responsible for taking the work off the queue, perhaps performing some post-checks, or validation of the work on an item in the queue then dispatching that work out to some client who will need to process or make some determination. Each consumer and producer would run in their own thread and potentially could be pinned to any CPU. Depending on what is required, it’s quite reasonable that the number of producers and consumers would need to scale up or down as clients and or workloads are running (some can go on and off line driven by various external events). The most critical measurement we would want to consider here would be the time it takes to produce or push a work item on the queue and for the work item to be removed from the queue. We consider other types of measurements as well later.
Running the benchmark
To enforce that we are not aligning the data, we use the
alignas
specifier for our data. The
struct
that we will be using is shown in Listing 1.
struct Benchmark
{
  uint64_t cycles{0};
  uint32_t serial{0};
};

template <typename Bench, int X>
struct Alignment
{
  alignas(X) Bench cb;
  Bench& get() { return cb; }
};
|
| Listing 1 |
We will store the number of cycles in the
struct
along with some other data fields. How we store these is shown in Listing 2 (not shown is the
GetTravelStore
method which is the same as
GetStore
). We used the
boost::lockfree::queue
for our testing the aligned section and we modify their implementation to disable alignment (not shown) for our baseline numbers.
std::unique_ptr<uint64_t>
  GetStore ( uint64_t iter )
{
  thread_local uint64_t* store{nullptr};

  if (store == nullptr)
    store = new uint64_t[iter];
  return std::unique_ptr<uint64_t>(store);
}
|
| Listing 2 |
In establishing our baseline number, we will consider various scenarios or ratios of numbers of producers to consumers. Currently we only display results for the ratio 2:2. Each consumer and each producer will spin in a busy loop to minimize overall cycles required to publish and or consume data. The code for producer and consumer is shown in Listing 3.
template <typename T, typename Q>
void producer(Q* q, uint32_t iterations)
{
  auto store = Thread::GetStore(iterations);
  while (Thread::g_pstart.load() == false) {}
  T d;
  d.get().serial = 0;
  int result = 0;
  for ( uint32_t j = 0; j < 2; ++j) // warm up
  for ( uint32_t i = 0; i < iterations; ++i)
  {
    ++d.get().serial;
    do { d.get().cycles = getcc_b();  }
      while (!q->push(d));
    store.get()[i] =
      getcc_e() - d.get().cycles;
    // busy work to throttle production
    // to eliminate "stuffed" queue
    //* No noticeable effect
    for (uint32_t k = 0; k<1000; ++k)
    {
      result += k+i;
    }
    // */
  }
  ++result;
  std::stringstream push;
  genStats(iterations, store, "1 Push", push);
  std::lock_guard<std::mutex>
    lock(Thread::g_cout_lock);
  std::cout << result << std::endl;
  Thread::g_output.emplace(push.str());
}
template <typename T, typename Q>
void consumer(Q* q, uint32_t iterations)
{
  auto store = Thread::GetStore(iterations);
  auto travel_store =
    Thread::GetTravelStore(iterations);

  while (Thread::g_cstart.load() == false) {}

  T d;
  uint64_t start;
  uint64_t end;
  for ( uint32_t j = 0; j < 2; ++j) // warm up
  for ( uint32_t i = 0; i < iterations; ++i)
  {
    do { start = getcc_b(); }
      while (!q->pop(d));
    end = getcc_e();
    travel_store.get()[i] =
        end - d.get().cycles;
    store.get()[i] = end - start;
  }

  std::stringstream trvl, pop;
  genStats(iterations,
        travel_store,
        "3 Travel",
        trvl);
  genStats(iterations,
        store,
        "2 Pop",
        pop);
  std::lock_guard<std::mutex>
    lock(Thread::g_cout_lock);
  Thread::g_output.emplace(pop.str());
  Thread::g_output.emplace(trvl.str());
}
|
| Listing 3 |
template<typename T,template<class...>typename Q>
void run ( int producers, int consumers )
{
  std::cout << "Alignment of T "
        << alignof(T)
        << std::endl;
  std::vector<std::unique_ptr<std::thread>>
    threads;
  threads.reserve(producers+consumers);
  Q<T> q(128);
  // need to make this a command line option
  // and do proper balancing between
  // consumers and producers
  uint32_t iterations = 10000000;
  for (int i = 0; i < producers; ++i)
  {
    threads.push_back(
        std::make_unique<std::thread>
           (producer<T,Q<T>>
          , &q
          , iterations));
    // adjust for physical cpu/core layout
    setAffinity(*threads.rbegin(), i*2);
  }
  for (int i = 0; i < consumers; ++i)
  {
    threads.push_back(
      std::make_unique<std::thread>
          (consumer<T,Q<T>>
         , &q
         , iterations));
    // adjust for physical cpu/core layout
    setAffinity(*threads.rbegin(), 4+(i*2));
  }
  Thread::g_cstart.store(true);
  usleep(500000);
  Thread::g_pstart.store(true);
  for (auto& i : threads)
  {
    i->join();
  }
  for (auto& i : Thread::g_output)
  {
    std::cout << i << std::endl;
  }
}
|
| Listing 4 |
Finally, for our benchmark without cache-line awareness, we put all of this together:
run<Alignment<
  Benchmark
  , alignof(Benchmark)>
  , boost::lockfree::bad_queue>
(producers, consumers);
We will pin each thread created to its very own CPU to reduce overall variance on measurements. This is done in the method
setAffinity
mentioned in the code examples but not shown. You can find more information about thread affinity on the Linux man pages [
Kerrisk
]. We will measure push, pop, and total queue traversal time (pop end time – push start time) along with various other metrics. These results are shown in Figure 1. All measurements are in cycles (using RDTSCP and CPUID instructions) using the recommended guidelines from Intel [
Paoloni10
]. These measurements are computed inside the functions
getcc_b
and
getcc_e
(not shown).
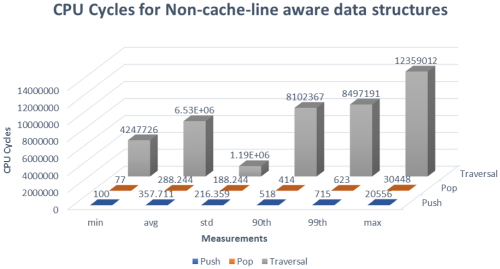
|
| Figure 1 |
Applying cache-line awareness to our example
Now that we have identified how we are going to take advantage of cache-line awareness in our queue, we will re-run our previous tests with the changes we just applied. We will now enable cache-line awareness by using the alignas specifier for our data. The code used here is:
  run<Alignment<
      Benchmark, 64>
    , boost::lockfree::queue>
    (producers, consumers);
We will run through the same scenarios as we saw in Figure 1. These results are shown in Figure 2.
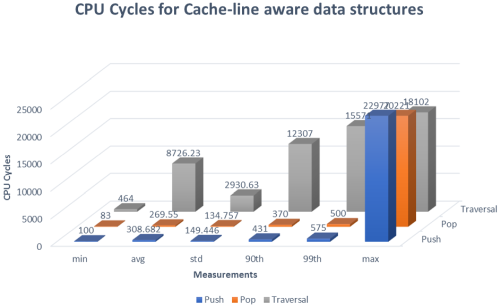
|
| Figure 2 |
Note: If the measurements are not clear in Figure 2, the max measurements for Push, Pop, and Traversal are observed as 22977, 20221, and 18102 respectively.
Analysis
Comparing where we started and where we ended up, there are several items of considerable mention. The first is that the distribution of the percentiles for Figure 1 clearly show fat tail properties mostly noticeably in the traversal measurements. Another quite fascinating point is that the 90th and 99th percentiles of all measurements dropped considerably in all operations. Push went from 518 cycles to 431 and 715 cycles to 575 for 90th and 99th percentiles. Pop, not necessarily as impressive as Push, went from 414 cycles to 370 and 623 cycles to 500 cycles respectively. Traversal was even more impressive going from 810236 cycles to 12307 and 8497191 cycles to 15571 for 90th and 99th percentiles respectively.
Conclusion and future direction
There are many items we didn’t address in this paper. For example, we did not discuss the data throughput through the queue as a function of cache-line awareness changes. We could have also considered measuring different scenarios and the ratios of producers to consumers. It is important to note that the problem addressed in this paper is just one instance of a group of problems collectively known as flow control problems. These problems exist in many domains, and are quite common in some aspects of financial technology, but have relevancy in many others. We mention the points above to illustrate different ways in which this problem can be expanded upon and perhaps further analysis may be continued.
Finally, as we were writing this paper, running measurements of various scenarios, the results were in many ways quite interesting and often initially appeared to be counter-intuitive, but after carefully examining the assembly and measuring the performance more closely the results made more sense. We can’t stress enough how important it is to measure your applications and the tools used to measure those applications.
Notes
Boost 1.63.0 and GCC 5.4.0 were used. For a complete package of the code used in this article and that which is referenced and not shown, please contact the authors directly. All measurements were the average of 1000 runs of 1e6 iterations for 2 consumers and 2 producer threads. Intel i7-3610QM CPU 2.30GHz 4 cores per socket for 8 cores total was used to produce all measurements discussed in the paper. Operating system used was Linux ll 4.12.5-gentoo.
References
[Bolosky93] William Bolosky and Michael Scott (1993) ‘False Sharing and its Effect on Shared Memory Performance’, originally published in Proceedings of the USENIX SEDMS IV Conference Sept 22–23 1993 , available at http://static.usenix.org/publications/library/proceedings/sedms4/full_papers/bolosky.txt
[Intel] ‘The Power of FPGAS’ available at https://www.intel.com/content/www/us/en/fpga/solutions.html
[Kerrisk] Michael Kerrisk (maintainer), Linux man pages online , http://man7.org/linux/man-pages/man3/pthread_setaffinity_np.3.html
[Levinthal09] David Levinthal PhD (2009) ‘Performance Analyis Guide for Intel ® Core™ i7 Processor and Intel ® Xeon™ 5500 processors’ at https://software.intel.com/sites/products/collateral/hpc/vtune/performance_analysis_guide.pdf
[Paoloni10] Gabriele Paolone (2010) How to Benchmark Code Execution Times on Intel IA-32 and IA-64 Instruction Set Architectures , published by Intel Corporation, https://www.intel.com/content/dam/www/public/us/en/documents/white-papers/ia-32-ia-64-benchmark-code-execution-paper.pdf
[Patrizio17] Andy Patrizio (2017) ‘Intel plans hybrid CPU-FPGA chips’, posted 5 October 2017 at https://www.networkworld.com/article/3230929/data-center/intel-unveils-hybrid-cpu-fpga-plans.html
[Tsang17] Stanley Tsang (2017) ‘Real-Time NUMA Node Performance Analysis Using Intel Performance Monitor’ at http://www.acceleware.com/blog/real-time-NUMA-node-performance-analysis-using-intel-performance-counter-monitor
[Wikipedia-1] ‘CPU cache’ at https://en.wikipedia.org/wiki/CPU_cache
[Wikipedia-2] ‘Non-uniform memory access’ at https://en.wikipedia.org/wiki/Non-uniform_memory_access